How to debug and test your regular expression (regex)

Regular expressions are such an incredibly convenient tool, available across so many languages that most developers will learn them sooner or later.

But regular expressions can become quite complex. The syntax is terse, subtle, and subject to combinatorial explosion.

The best way to improve your skills is to write a regular expression, test it on some real data, debug the expression, improve it and repeat this process again and again.

This is why regex101 (https://regex101.com/) is such a great tool.

Not only does it let you test out your regexes on a sample set, color coding your match groups:

But it also gives you a full explanation of what’s going on under the hood.

You can review the match information:

And even choose your favorite flavor (PHP, JavaScript, Python or Golan)

How to run PySpark 2.4.0 in Jupyter Notebook on Mac

Install Jupyter notebook

$ pip3 install jupyter

Install PySpark

Make sure you have Java 8 or higher installed on your computer and visit the Spark download page

Select the latest Spark release, a prebuilt package for Hadoop, and download it directly.

Unzip it and move it to your /opt folder:

$ tar -xzf spark-2.4.0-bin-hadoop2.7.tgz
$ sudo mv spark-2.4.0-bin-hadoop2.7 /opt/spark-2.4.0

A symbolic link is like a shortcut from one file to another. The contents of a symbolic link are the address of the actual file or folder that is being linked to.

Create a symbolic link (this will let you have multiple spark versions):

$ sudo ln -s /opt/spark-2.4.0 /opt/spark̀

Check that the link was indeed created

$ ls -l /opt/spark̀

lrwxr-xr-x 1 root wheel 16 Dec 26 15:08 /opt/spark̀ -> /opt/spark-2.4.0

Finally, tell your bash where to find Spark. To find what shell you are using, type:

$ echo $SHELL
/bin/bash

To do so, edit your bash file:

$ nano ~/.bash_profile

configure your $PATH variables by adding the following lines to your ~/.bash_profile file:

export SPARK_HOME=/opt/spark
export PATH=$SPARK_HOME/bin:$PATH
# For python 3, You have to add the line below or you will get an error
export PYSPARK_PYTHON=python3

Now to run PySpark in Jupyter you’ll need to update the PySpark driver environment variables. Just add these lines to your ~/.bash_profile file:

export PYSPARK_DRIVER_PYTHON=jupyter
export PYSPARK_DRIVER_PYTHON_OPTS='notebook'

Your ~/.bash_profile file may look like this:

Restart (our just source) your terminal and launch PySpark:

$ pyspark

This command should start a Jupyter Notebook in your web browser. Create a new notebook by clicking on ‘New’ > ‘Notebooks Python [default]’.

Running PySpark in Jupyter Notebook

The PySpark context can be

sc = SparkContext.getOrCreate()

To check if your notebook is initialized with SparkContext, you could try the following codes in your notebook:

sc = SparkContext.getOrCreate()
import numpy as np
TOTAL = 10000
dots = sc.parallelize([2.0 * np.random.random(2) - 1.0 for i in range(TOTAL)]).cache()
print("Number of random points:", dots.count())
stats = dots.stats()
print('Mean:', stats.mean())
print('stdev:', stats.stdev())

The result:

Running PySpark in your favorite IDE

Sometimes you need a full IDE to create more complex code, and PySpark isn’t on sys.path by default, but that doesn’t mean it can’t be used as a regular library. You can address this by adding PySpark to sys.path at runtime. The package findspark does that for you.

To install findspark just type:

$ pip3 install findspark

And then on your IDE (I use Eclipse and Pydev) to initialize PySpark, just call:

import findspark
findspark.init()
import pyspark
sc = pyspark.SparkContext(appName="myAppName")

Here is a full example of a standalone application to test PySpark locally 

import findspark
findspark.init()
import random
from pyspark import SparkContext
sc = SparkContext(appName="EstimatePi")
def inside(p):
x, y = random.random(), random.random()
return x<em>x + y</em>y &lt; 1
NUM_SAMPLES = 1000000
count = sc.parallelize(range(0, NUM_SAMPLES)) \
.filter(inside).count()
print("Pi is roughly %f" % (4.0 * count / NUM_SAMPLES))
sc.stop()

The result:

Enjoy!

Based on this article and on this article

Fighting Digital Payments Fraud with Deep Learning

Interesting presentation today at the DataScience SG meet-up

Conventional fraud prevention methods are rule based, expansive and slow to implement

Q1 2016: $5 of every $100 subject to fraud attack!

Key fraud types: account takeover, friendly fraud & fraud due to stolen card information

Consumers want: easy, instant, customized, mobile and dynamic options to suit their personal situation. Consumers do NOT want to be part of the fraud detection process.

Key technology enablers:

Historically fraud detection systems have relied on rues hand-curated by fraud experts to catch fraudulent activity.

An auto-encoder is a neural network trained to reconstruct its inputs, which forces a hidden layer to try and to learn good representations of the input

Kaggle dataset:

Train Autoencoder on normal transactions and using the Autoencoder transformation there is now a clear separation between the normal and the fraudulent transactions.

Twitter’s real-time stack: Processing billions of events with Heron and DistributedLog

At the first day of the Strata+Hadoop, Maosong Fu, Tech Lead for Realtime Compute at Twitter shared some details on Twitter’s real-time stack

img_6462

There are many industries where optimizing in real-time can have a large impact on overall business performance, leading to instant benefits in customer acquisition, retention, and marketing.

valueofdata

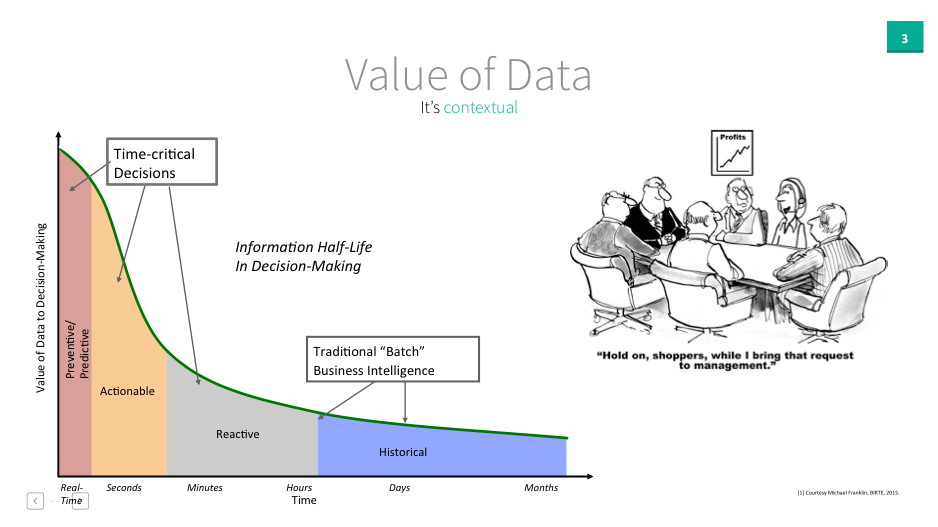
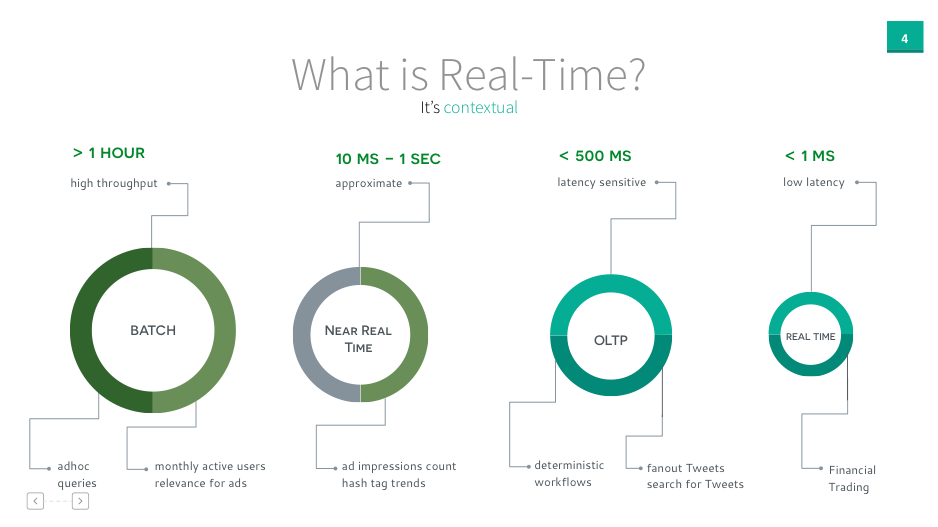
But how fast is real-time? It depends on the context, whether it’s financial trading, tweeting, ad impression count or monthly dashboard.

what-is-real-time


Earlier Twitter messaging stack

twittermessaging

Kestrel is a message queue server we use to asynchronously connect many of the services and functions underlying the Twitter product. For example, when users update, any tweets destined for SMS delivery are queued in a Kestrel; the SMS service then reads tweets from this queue and communicates with the SMS carriers for delivery to phones. This implementation isolates the behavior of SMS delivery from the behavior of the rest of the system, making SMS delivery easier to operate, maintain, and scale independently.

Scribe is a server for aggregating log data streamed in real time from a large number of servers.

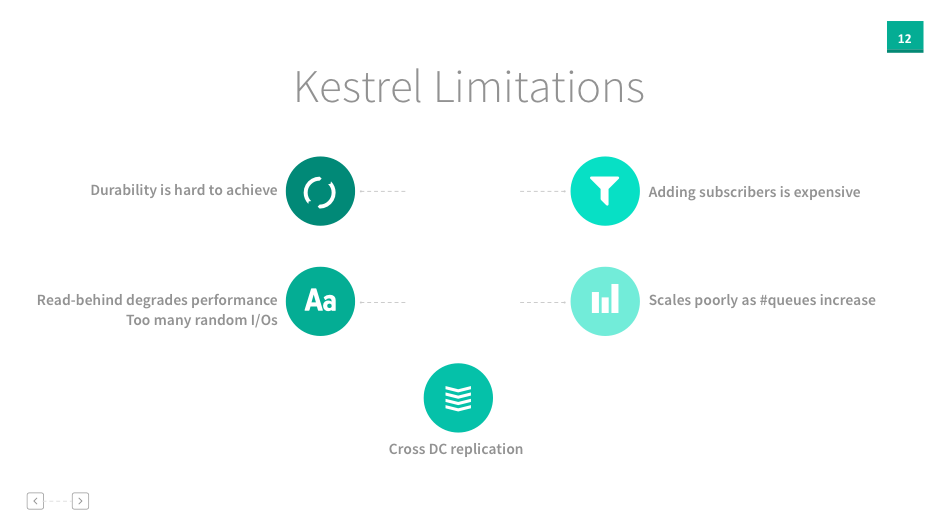
Some of Kestrel’s limitations are listed in the below:

  • Durability is hard to achieve
  • Read-behind degrades performance
  • Adding subscribers is expensive
  • Scales poorly as number of queues increase
  • Cross DC replication

kestrellimitations

From Twitter Github:

We’ve deprecated Kestrel because internally we’ve shifted our attention to an alternative project based on DistributedLog, and we no longer have the resources to contribute fixes or accept pull requests. While Kestrel is a great solution up to a certain point (simple, fast, durable, and easy to deploy), it hasn’t been able to cope with Twitter’s massive scale (in terms of number of tenants, QPS, operability, diversity of workloads etc.) or operating environment (an Aurora cluster without persistent storage).

Kafka™ is used for building real-time data pipelines and streaming apps. It is horizontally scalable, fault-tolerant, wicked fast, and runs in production in thousands of companies.

Kafka relies on file system page cache with performance degradation when subscribers fall behind – too many random I/O

kafkalimitations

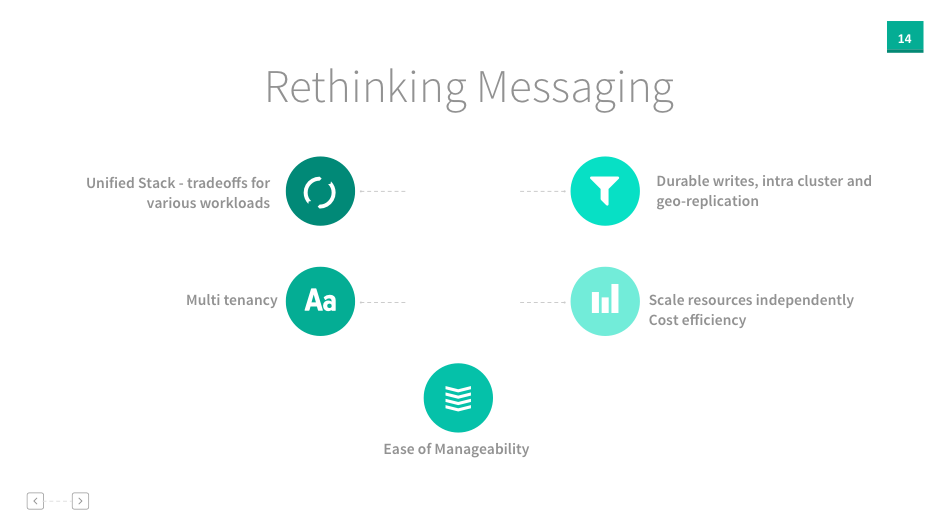
Rethinking messaging

rethinkingmessaging

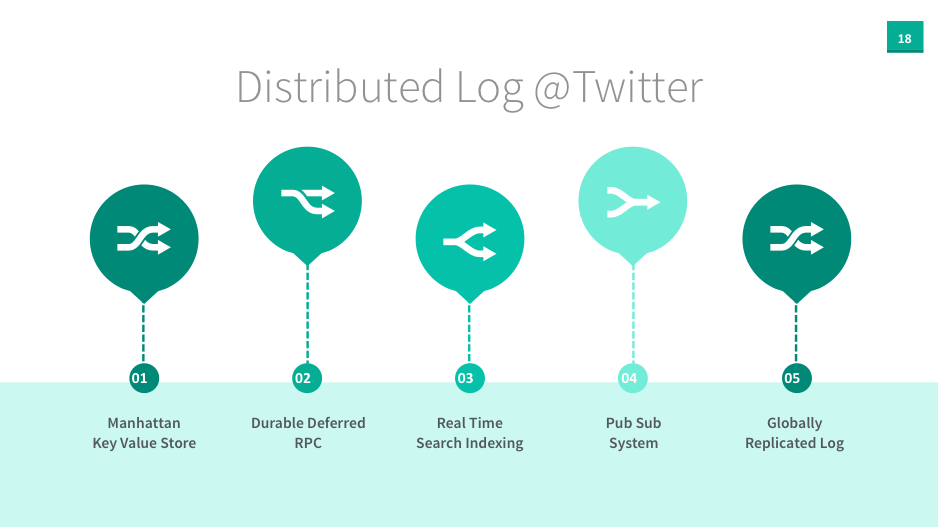
Apache DistributedLog (DL) is a high-throughput, low-latency replicated log service, offering durability, replication and strong consistency as essentials for building reliable real-time applications.

distributedlogs

Event Bus

eventbus

Features of DistributedLog at Twitter:

High Performance

DL is able to provide milliseconds latency on durable writes with a large number of concurrent logs, and handle high volume reads and writes per second from thousands of clients.

Durable and Consistent

Messages are persisted on disk and replicated to store multiple copies to prevent data loss. They are guaranteed to be consistent among writers and readers in terms of strict ordering.

Efficient Fan-in and Fan-out

DL provides an efficient service layer that is optimized for running in a multi- tenant datacenter environment such as Mesos or Yarn. The service layer is able to support large scale writes (fan-in) and reads (fan-out).

Various Workloads

DL supports various workloads from latency-sensitive online transaction processing (OLTP) applications (e.g. WAL for distributed database and in-memory replicated state machines), real-time stream ingestion and computing, to analytical processing.

Multi Tenant

To support a large number of logs for multi-tenants, DL is designed for I/O isolation in real-world workloads.

Layered Architecture

DL has a modern layered architecture design, which separates the stateless service tier from the stateful storage tier. To support large scale writes (fan- in) and reads (fan-out), DL allows scaling storage independent of scaling CPU and memory.


distibutedlogs

Storm was no longer able to support Twitter’s requirements and although Twitter improved Storm’s performance eventually Twitter decided to develop Heron.

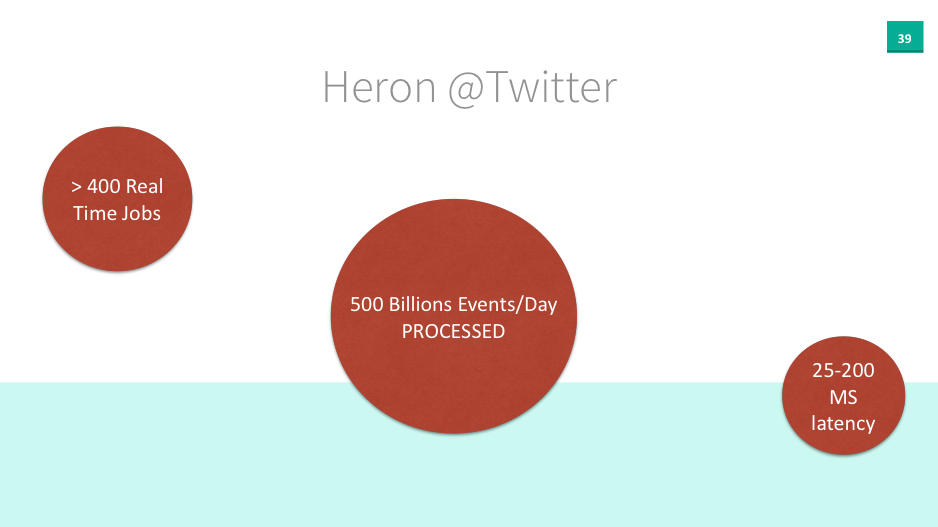
Heron is a realtime, distributed, fault-tolerant stream processing engine from Twitter. Heron is built with a wide array of architectural improvements that contribute to high efficiency gains.

heron

Heron has powered all realtime analytics with varied use cases at Twitter since 2014. Incident reports dropped by an order of magnitude demonstrating proven reliability and scalability


heronusecases

Heron is in production for the last 3 years, reducing hardware requirements by 3x. Heron is highly scalable both in the ability to execute large number of components for each topology and the ability to launch and track large numbers of topologies.


heronattwitter

Lambda architecture is a data-processing architecture designed to handle massive quantities of data by taking advantage of both batch– and stream-processing methods. This approach to architecture attempts to balance latency, throughput, and fault-tolerance by using batch processing to provide comprehensive and accurate views of batch data, while simultaneously using real-time stream processing to provide views of online data. The two view outputs may be joined before presentation.

The way this works is that an immutable sequence of records is captured and fed into a batch system and a stream processing system in parallel. You implement your transformation logic twice, once in the batch system and once in the stream processing system. You stitch together the results from both systems at query time to produce a complete answer.

lambda-16338c9225c8e6b0c33a3f953133a4cb

Lambda Architecture: the good

lambdathegood

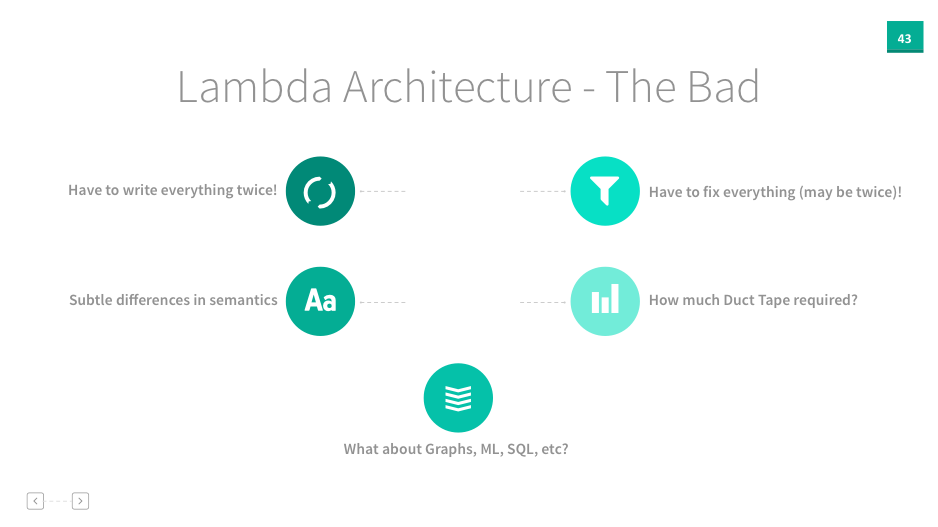
The problem with the Lambda Architecture is that maintaining code that needs to produce the same result in two complex distributed systems is exactly as painful as it seems like it would be.

LambdaTheBad.png

Summingbird to the Rescue! Summingbird is a library that lets you write MapReduce programs that look like native Scala or Java collection transformations and execute them on a number of well-known distributed MapReduce platforms, including Storm and Scalding.

Summingbird.png

Curious to Learn More?

curioustolearnmore


Interested in Heron?

Code at: https://github.com/twitter/heron

http://twitter.github.io/heron/


inerestedinheron

Data Scientists, With Great Power Comes Great Responsibility

It is a good time to be a data scientist.

With great power comes great responsibilityIn 2012 the Harvard Business Review hailed the role of data scientist “The sexiest job of the 21st century”. Data scientists are working at both start-ups and well-established companies like Twitter, Facebook, LinkedIn and Google receiving a total average salary of $98k ($144k for US respondents only) .

Data – and the insights it provides – gives the business the upper hand to better understand the clients, prospects and the overall operation. Till recently, it was not uncommon for million- and -billion- dollar deals to be accepted or rejected based on the intuition & instinct. Data scientists add value to the business by leading to informed and timely decision-making process using quantifiable, data driven evidence and by translating the data into actionable insights.

So you have a rewarding corporate day job, how about doing data science for social good?

You have been endowed with tremendous data science and leadership powers and the world needs them! Mission-driven organizations are tackling huge social issues like poverty, global warming and public health. Many have tons of unexplored data that could help them make a bigger impact, but don’t have the time or skills to leverage it. Data science has the power to move the needle on critical issues but organizations need access to data superheroes like you to use it

DataKind Blog 

There are a few of programs that exist specifically to facilitate this, the United Nations #VisualizeChange challenge is the one I’ve just taken.

As the Chief Information Technology Officer, I invite the global community of data scientists to partner with the United Nations in our mandate to harness the power of data analytics and visualization to uncover new knowledge about UN related topics such as human rights, environmental issues, and political affairs.

Ms. Atefeh Riazi – Chief Information Technology Officer at United Nations

The United Nations UNITE IDEAS published a number of data visualization challenges. For the latest challenge, #VisualizeChange: A World Humanitarian Summit Data Challenge , we were provided with unstructured information from nearly 500 documents that the consultation process has generated as per July 2015. The qualitative data is categorized in emerging themes and sub-themes that have been identified according to a developed taxonomy. The challenge was to process the consultation data in order to develop an original and thought provoking illustration of information collected through the consultation process.

Over the weekend I’ve built an interactive visualization using open-source tools (R and Shiny) to help and identify innovative ideas and innovative technologies in humanitarian action, especially on communication and IT technology. By making it to the top 10 finalists, the solution is showcased here, as well as on the Unite Ideas platform and other related events worldwide, so I hope that this visualization will be used to uncover new knowledge.

#VisualizeChange Top 10 Visualizations

Opening these challenges to the public helps raising awareness – during the process of analysing the data and designing the visualization I’ve learned on some of most pressing humanitarian needs such as Damage and Need Assessment, Communication, Online Payment and more and on the most promising technologies such as Mobile, Data Analytics, Social Media, Crowdsourcing and more.

#VisualizeChange Innovative Ideas and Technologies

Kaggle is another great platform where you can apply your data science skills for social good. How about applying image classification algorithms to automate the right whale recognition process using a dataset of aerial photographs of individual whale? With fewer than 500 North Atlantic right whales left in the world’s oceans, knowing the health and status of each whale is integral to the efforts of researchers working to protect the species from extinction.

Right Whale Recognition

There are other excellent programs.

The DSSG program ran by the University of Chicago, where aspiring data scientists take on real-world problems in education, health, energy, transportation, economic development, international development and work for three months on data mining, machine learning, big data, and data science projects with social impact.

DataKind bring together top data scientists with leading social change organizations to collaborate on cutting-edge analytics and advanced algorithms to maximize social impact.

Bayes Impact  is a group of practical idealists who believe that applied properly, data can be used to solve the world’s biggest problems.

Are you aware of any other organizations and platforms doing data science for social good? Feel free to share.

Tools & Technologies

R for analysis & visualization
Shiny.io for hosting the interactive R script
The complete source code and the data is hosted here


Bioinformatic Is Cool, I Mean Really Cool

I’ve been fascinated by genomic research for years.  While successfully implementing a fairly large and diverse set of algorithms (segmentation, image processing and machine learning) on text, image and other semi-structured datasets, till recently I didn’t have much exposure to the exciting field of bioinformatics, processing DNA and RNA sequences.

After completing Bioinformatics Methods I  and Bioinformatics Methods II (thank you Professor Nicholas Provart, University of Toronto) I have a better appreciation of the important roles of Bioinformatics in medicinal sciences and in drug discovery, diagnosis and disease management, but also a better appreciation of the complexity involved with the processing of large biological datasets.

bioinformatics

Topics covered in these two courses include multiple sequence alignments, phylogenetics, gene expression data analysis, and protein interaction networks, in two separate parts. The first part, Bioinformatic Methods I, dealt with databases, Blast, multiple sequence alignments, phylogenetics, selection analysis and metagenomics. The second part, Bioinformatic Methods II, dealt with motif searching, protein-protein interactions, structural bioinformatics, gene expression data analysis, and cis-element predictions.

Please find below a short list of tools and resources I’ve used while completing the different labs:

NCBI/Blast I

http://www.ncbi.nlm.nih.gov/

Multiple Sequence Alignments

http://megasoftware.net (download tool)

http://dialign.gobics.de/

http://mafft.cbrc.jp/alignment/server/

Phylogenetic

https://code.google.com/p/jmodeltest2/

http://www.megasoftware.net/

http://evolution.genetics.washington.edu/phylip.html

http://bar.utoronto.ca/webphylip/

http://mobyle.pasteur.fr/cgi-bin/portal.py#forms::fastdnaml

Selection Analysis

http://selecton.tau.ac.il/

http://bar.utoronto.ca/EMBOSS

http://www.datamonkey.org/                 

NEXT GENERATION SEQUENCING APPLICATIONS: RNA-SEQ AND METAGENOMICS                                    

http://mpss.udel.edu

http://mockler-jbrowse.mocklerlab.org/jbrowse.athal/?loc=Chr2%3A12414112..12415692

http://www.ncbi.nlm.nih.gov/pubmed/20410051

METAGENOMICS

http://metagenomics.anl.gov/

Protein Domain, Motif and Profile Analysis

http://www.ncbi.nlm.nih.gov/guide/domains-structures/

http://www.ncbi.nlm.nih.gov/Structure/cdd/wrpsb.cgi               

http://smart.embl-heidelberg.de/

http://pfam.xfam.org/search

http://www.ebi.ac.uk/InterProScan/

Protein-protein interactions               

http://mips.gsf.de/proj/ppi/  

http://dip.doe-mbi.ucla.edu/dip/Main.cgi

http://www.thebiogrid.org/index.php

http://www.cytoscape.org/download.html   (download tool)             

Structural Bioinformatics

http://pdb.org  

http://www.ncbi.nlm.nih.gov/Structure/VAST/vastsearch.html  

http://pymol.org/edu (download tool)            

Gene Expression Analysis

http://www.ncbi.nlm.nih.gov/sra  

http://bar.utoronto.ca/BioC/

Gene Expression Data Analysis

http://bar.utoronto.ca/ntools/cgi-bin/ntools_expression_angler.cgi

http://bar.utoronto.ca/affydb/cgi-bin/affy_db_exprss_browser_in.cgi

http://bioinfo.cau.edu.cn/agriGO/analysis.php

http://bar.utoronto.ca/efp/

http://atted.jp/

http://bar.utoronto.ca/ntools/cgi-bin/ntools_venn_selector.cgi

Cis regulatory element mapping and prediction

http://bar.utoronto.ca/ntools/cgi-bin/BAR_Promomer.cgi

http://www.bioinformatics2.wsu.edu/cgi-bin/Athena/cgi/home.pl

http://jaspar.genereg.net/

http://meme-suite.org/tools/meme

Additional Coursers

https://class.coursera.org/molevol-002 Computational Molecular Evolution

https://www.coursera.org/course/pkubioinfo Bioinformatics

https://www.coursera.org/course/programming1 Python

https://www.coursera.org/course/webapplications Web Applications (Ruby on Rails)

https://www.coursera.org/course/epigenetics Epigenetics

https://www.coursera.org/course/genomicmedicine Genomic & Precision Medicine

https://www.coursera.org/course/usefulgenetics Useful Genetics

Book

Zvelebil & Baum 2008 Understanding Bioinformatics. Garland Science, New York

Understanding Bioinformatics

The Evolving Role of the Chief Data Officer

In recent years, there has been a significant rise in the appointments of Chief Data Officers (CDOs).

Although this role is still very new, Gartner predicts that 25 percent of organizations will have a CDO by 2017, with that figure rising to 50 percent in heavily regulated industries such as banking and insurance. Underlying this change is an increasing recognition of the value of data as an asset.

Last week the CDOForum held an event chaired by Dr. Shonali Krishnaswamy Head Data Analytics Department I2R, evaluating the role of the Chief Data Officer and looking into data monetization strategies and real-life Big Data case studies.

According to Debra Logan, Vice President and Gartner Fellow, the

Chief Data Officer (CDO) is a senior executive who bears responsibility for the firm’s enterprise wide data and information strategy, governance, control, policy development, and effective exploitation. The CDO’s role will combine accountability and responsibility for information protection and privacy, information governance, data quality and data life cycle management, along with the exploitation of data assets to create business value.

To succeed in this role, the CDO should never be “siloed” and work closely with other senior leaders to innovate and to transform the business:

  • With the Chief Operating Officers (COO) and with the Chief Marketing Officer (CMO) on creating new business models, including data driven products and services, mass experimentation and on ways to acquire, grow and retain customers including personalization, profitability and retention.
  • With the COO on ways to optimize the operation, counter frauds and threats including business process operations, infrastructure & asset efficiency, counter fraud and public safety and defense.
  • With the Chief Information Officer (CIO) on ways to maximize insights, ensure trust and improve IT economics, including enabling full spectrum of analytics and optimizing big data & analytics infrastructure.
  • With the Chief Human Resource Officer (CHRO) on ways to transform management processes including planning and performance management, talent management, health & benefits optimization, incentive compensation management and human capital management.
  • With the Chief Risk Officer (CRO), CFO and COO on managing risk including risk adjusted performance, financial risk and IT risk & security.

To unleash the true power of data, many CDOs are expanding their role as a way of expanding scope and creating an innovation agenda, moving from Basics (data strategy, data governance, data architecture, data stewardship, data integration and data management) to Advanced, implementing machine learning & predictive analytics, big data solutions, developing new products and services and enhancing customer experience.

Conclusion

Organizations have struggled for decades with the value of their data assets. Having a new chief officer leading all the enterprise-wide management of data assets will ensure maximum benefits to the organization.


Level up with Massive Open Online Courses (MOOC)

Last week I was attending the IDC FutureScape, an annual event where IDC, a leading market research, analysis and advisory firm, shared their top 10 decision imperatives for the 2015 CIO agenda.

The keynote speaker, Sandra Ng, Group Vice President at ICT Practice, went through the slides mentioning the newest technologies and keywords like Big Data and Analytics, Data Science, Internet of Things, Digital Transformation, IT as a service (ITaaS), Cyber Security, DevOps , Application Provisioning and more.

IDC Predictions

Eight years ago when I’ve completed my M.Sc in Computer Science, most of these technologies were either very new or didn’t exist at all. Since the IT landscape is evolving so fast, how can we keep up and stay relevant as IT professionals?

There is obviously the traditional way of registering for an instructor led training, be it PMP, Prince2, advanced .NET or Java, sitting in smaller groups for a couple of days, having a nice lunch and getting a colorful certificate.

But there are other options to access a world-class education.

A massive open online course (MOOC) is an online course aimed at unlimited participation and open access via the web. In addition to traditional course materials such as videos, readings, and problem sets, MOOCs provide interactive user forums that help build a community for students, professors, and teaching assistants (TAs).
http://en.wikipedia.org/wiki/Massive_open_online_course

Are you keen to learn more on how Google cracked house number identification in Street View, achieving more than 98% recognition rates on these blurry images?

StreetviewWhy don’t you join Stanford’s Andrew Ng and his online class of 100,000 students attending his famous Machine Learning course? I took this course two years ago, and this guy is awesome! So awesome that Baidu, the Chinese search engine, just hired him as a chief scientist to open a new artificial intelligence lab in Silicon Valley.

You can also join Stanford’s’ professors, Trevor Hastie and Robert Tibshirani, teaching Statistical Learning, using open source tools and a free version of the text book An Introduction to Statistical Learning, with Applications in R – yup, it’s all free!

There is a huge variety of online classes, from Science to Art to Technology, from top universities like Harvard, Berkeley, Yale and others – Google the name of the university plus “MOOC” and start your journey.

Level Up!


How Individualized Medical Geographic Information Systems and Big Data will Transform Healthcare

The modern healthcare system is experiencing a significant disruptive change consistent with the technological shifts that have altered the communications, publishing, travel, and banking industries. The roots of this transformation can be found across many topics including the Quantified Self movement, mobile technology platforms, wearable computing, and rapid advances in genomic and precision medicine.

Here are some conclusions and thoughts following a seminar held last week at the Institute of Systems Science at the National University of Singapore (NUS).

Dr. Steven Tucker, MD, shared his view of how individualised medical Geographic Information Systems (GIS) will transform medicine:

“This is a medical Geographical Information Systems, compared to a Google map of the individual. We can do this with biology and health”.

Dr. Tucker presenting the medical Geographic Information Systems (GIS)

There’s much more to it than just collecting data points from your mobile phone or from a wearable device:

“Your DNA plus your bacteria and your epigenome (a record of the chemical changes to the DNA and histone proteins of an organism) exposures, protein and unique appearance go to making you a unique biological individual. We are not in a standard distribution anymore… That is transformative” said Dr. Tucker.

These singular, individual data and information set up a remarkable and unprecedented opportunity to improve medical treatment and develop preventive strategies to preserve health.

But how is this related to Big Data?

Michael Snyder of Stanford University was one of the first humans to have such a construct made of himself. Snyder had not only gene expression analysed, but also proteomic and metabalomic sequencing as well, as described in Topol’s recent article in Cell, “Individualized Medicine from Prewomb to Tomb” (March 27, 2014).

template_cell

The procedure required one Terabyte of storage for the DNA sequence, two Terabytes for the epigenomic data, and three Terabytes for the microbiome, the article said. Storage requirements grow quickly to one Petaybytes (1,000 Terabytes) for 100 people, so do the math of how many Petabytes of storage are required for storing the individual data of millions of people.

“The longer you can follow a person, the more you’ll learn about their health states, the more you can do to help them stay healthy. That’s the way it should be.” (Michael Snyder, Making It Personal).

Comments, questions?

Let me know.